In recent years, solar photovoltaic (PV) systems have emerged as a key solution for sustainable energy generation worldwide. Yet, their real-world performance is highly influenced by environmental factors—temperature being one of the most critical. Among the various metrics used to evaluate PV efficiency under different conditions, the Temperature Coefficient of Power (Pmax) stands out as a vital parameter. It represents the percentage reduction in output power for every one-degree Celsius increase above the standard test condition (25°C). In Steelbridge Export we will go further.
Thermal Power Coefficient in Solar Panels: A Critical Efficiency Factor in Middle Eastern Climates
While this value may seem modest in cooler climates, its significance amplifies in hot regions such as the Middle East, where ambient temperatures regularly exceed 40°C and module surface temperatures can climb even higher. In these environments, thermal losses can substantially reduce energy yield, particularly for modules with poor thermal characteristics. Thus, understanding and minimizing the impact of the temperature coefficient is essential for optimizing system design and ensuring investment viability in high-temperature markets.
Thermal Power Coefficient in Solar Panels
The temperature coefficient of power—commonly expressed in %/°C—is a specification that indicates how much a solar module’s maximum power output (Pmax) decreases as cell temperature increases beyond standard test conditions. Typically, PV modules are rated under STC (Standard Test Conditions) at 25°C cell temperature. However, under real-world operating conditions, especially in hot climates, the temperature of solar cells can rise significantly above this reference value. Mathematically, the output power under elevated temperature can be estimated as: P_actual = P_rated × [1 + γ × (T_cell – 25)] Where: – P_actual is the real output power – P_rated is the nominal rated power under STC – T_cell is the operating cell temperature – γ is the temperature coefficient of Pmax (typically negative) For example, a module with a coefficient of -0.34%/°C will lose 3.4% of its rated power if the cell temperature reaches 35°C, and nearly 10% at 55°C. Such reductions can severely impact the actual energy yield and return on investment—especially when accumulated over large-scale installations and long operational lifespans.
Visualizing Thermal Derating: The Power of Data Representation
In photovoltaic engineering, metrics such as the temperature coefficient of power (Pmax) are indispensable for evaluating the real-world efficiency of solar modules. However, numerical values alone often fail to convey the tangible impact of thermal stress on energy output. To bridge this gap between data and understanding, a thermal derating diagram becomes an essential visual tool.
Such a graph plots cell temperature on the x-axis (typically from 25°C to 80°C) and normalized power output on the y-axis (expressed as a percentage of rated power). When applied across multiple module technologies—such as ABC N-type (Aiko), TOPCon N-type (Trina), and PERC P-type (LONGi)—the graph clearly reveals how different materials and architectures respond to elevated thermal loads.
For instance, a panel with a -0.34%/°C coefficient will exhibit a steady decline from 100% at 25°C to approximately 75% at 80°C. In contrast, a high-performance module like Aiko Solar’s ABC with a -0.26%/°C coefficient will retain nearly 85% output at the same temperature. While this 10% gap may seem incremental, its implications are massive when extrapolated over:
• Tens of thousands of modules
3
• Daily irradiance cycles in desert regions
• A 25-year plant lifespan
The visual narrative of thermal loss transforms abstract numbers into a compelling design insight. It enables engineers to identify tipping points where module selection begins to impact bankability, yield forecasting, and inverter sizing.
In conclusion, including a thermal derating diagram is not a stylistic addition—it is a scientific imperative. It translates thermal coefficients into operational risk and profitability language, making it an indispensable element of serious PV system design in regions like the Middle East.
Thermal Coefficient Comparison Among Leading PV Brands
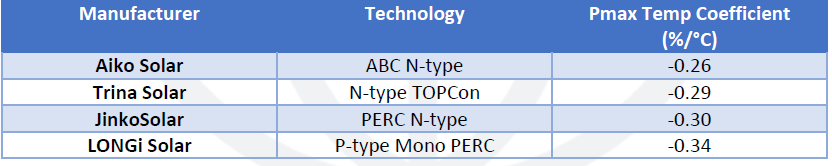
Not all solar modules respond equally to heat. The type of solar cell technology used—such as P-type PERC, N-type TOPCon, or advanced back-contact architectures—plays a significant role in determining a module’s thermal performance. Manufacturers often publish their Pmax temperature coefficients, allowing designers to assess real-world energy losses in hot environments. The following table compares the temperature coefficients of leading solar panel brands:
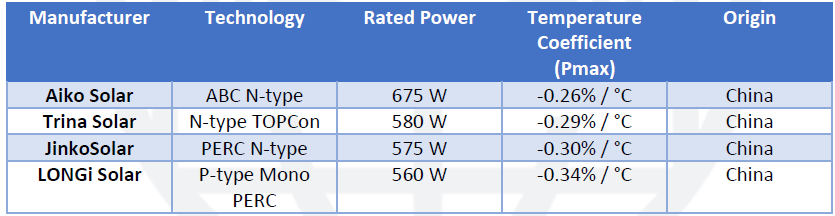
Aiko Solar’s modules stand out with one of the lowest thermal loss rates in the industry, thanks to their cutting-edge All Back Contact (ABC) N-type cell technology. With a Pmax temperature coefficient of just -0.26%/°C, they demonstrate superior resistance to thermal derating compared to traditional PERC and even TOPCon-based modules.
In hot climates such as those in the Middle East, where module surface temperatures often exceed 60°C, this difference translates to significantly higher real-world energy yields, longer system stability, and improved return on investment. Choosing panels like Aiko Solar is not merely a technical decision—it’s a strategic one.
Thermal Performance in Middle Eastern Climates
In the Middle East, solar power systems face a unique set of environmental challenges, primarily stemming from extreme heat, high solar irradiance, and limited natural cooling. Countries such as the United Arab Emirates, Saudi Arabia, Iran, and Kuwait experience prolonged periods of ambient temperatures exceeding 40°C, with PV module surface temperatures often climbing to 60–75°C during peak summer. Under these conditions, the temperature coefficient of power becomes a decisive factor in real-world energy yield. For instance, a panel with a coefficient of -0.34%/°C will experience nearly 17% power loss when the cell temperature reaches 75°C. In contrast, a high-efficiency panel like Aiko Solar, with a coefficient of only -0.26%/°C, would suffer a loss of approximately 13% under the same thermal load—a relative improvement of over 4%. Anchoring Thermal Assessment in Global Standards
While empirical data such as temperature coefficients offer critical design insights, their true value is realized only when framed within internationally recognized testing and certification standards. Two particular frameworks are instrumental in this regard: IEC 61215 and IEC 61724.
IEC 61215 – Design Qualification and Type Approval
This standard outlines rigorous testing protocols for photovoltaic modules, including thermal cycling, damp heat, and maximum power determination under elevated temperatures. Importantly, it simulates long-term exposure to thermal stresses typical of arid climates. Modules that meet IEC 61215 requirements are validated for structural integrity, thermal resilience, and stable power output over decades of operation.
IEC 61724 – Performance Monitoring and Energy Yield Analysis
IEC 61724 focuses on field performance monitoring, providing methodologies for integrating temperature sensors, tracking module temperature in real-time, and correcting energy yield estimates accordingly. This standard reinforces the relevance of thermal coefficients not just at design time, but throughout the lifecycle of a solar power plant.
By embedding temperature performance analysis within these frameworks, the article can demonstrate that thermal behavior is not just an operational concern—it is a compliance requirement, a bankability factor, and a technical necessity for grid-tied deployment in high-temperature regions.
In doing so, the selection of modules like Aiko Solar’s ABC series—with superior thermal coefficients—is shown to not only improve yield but also enhance alignment with global benchmarks. This makes the technology more attractive to financial institutions, insurance underwriters, and international EPC contractors seeking standards-compliant, low-risk solar assets. This performance delta may appear small at first glance, but across a utility-scale solar plant with thousands of modules, the difference translates into:
- Higher daily energy production
- Faster payback period
- Lower Levelized Cost of Energy (LCOE)
- Better performance warranties and investor confidence
Moreover, the thermal stability offered by advanced N-type technologies—particularly those with All Back Contact (ABC) structures, like in Aiko Solar modules—contributes to longer module lifespan, reduced stress on inverters, and enhanced grid reliability in desert climates. In short, thermal performance is not a minor detail—it is a fundamental design criterion for PV deployment in the Middle East.
Conclusion and Strategic Recommendations
Economic Sensitivity of Thermal Loss: CAPEX and LCOE Ramifications
While technical metrics such as Pmax temperature coefficients are critical in system design, their financial implications are often underestimated. In high-temperature regions like the Middle East, even modest differences in thermal performance can substantially affect a project’s capital efficiency, profitability, and long-term risk exposure.
Consider two utility-scale PV modules: one with a temperature coefficient of -0.26%/°C and another with -0.34%/°C. At a cell operating temperature of 75°C—common during summer months in desert environments—the respective power losses are approximately 13% and 17%. This 4% differential, when scaled to a 100 MW plant operating over 25 years, translates into more than 120 GWh of additional generation for the better-performing module.
The economic consequences of this performance delta are significant:
- Levelized Cost of Energy (LCOE): Higher output directly reduces the cost per kilowatt-hour, enhancing competitiveness in both PPA pricing and merchant market conditions.
- Payback Period: Improved energy yield shortens the time required to recover initial investment, improving internal rate of return (IRR).
- Debt Service Coverage Ratio (DSCR): More stable and higher output enhances the project’s ability to meet financing obligations, thus lowering lending risk.
- Operational Resilience: Lower thermal degradation reduces inverter clipping, minimizes panel overheating risks, and extends the effective lifetime of the system, reducing O&M expenses.
From an investor’s standpoint, thermal resilience is not merely a technical specification—it is a key driver of project bankability. Selecting modules with superior temperature behavior like Aiko Solar’s ABC N-type series is a financially strategic decision that mitigates risk and maximizes return, especially in markets subject to extreme environmental stress.
As solar deployment accelerates across the Middle East, system designers and developers must go beyond laboratory efficiency ratings and consider thermal behavior as a primary factor in module selection. In high-temperature environments, the Temperature Coefficient of Pmax plays a vital role in determining actual energy output, operational stability, and long-term profitability.
PV modules with lower thermal coefficients deliver significantly better energy yield under hot conditions, reduce system stress, and enhance long-term asset value. Technologies like N-type ABC (All Back Contact)—as adopted by Aiko Solar—offer clear advantages in thermal resilience, making them ideal candidates for utility-scale projects in the region.
To optimize system performance in the Middle East, the following strategies are strongly recommended:
- Prioritize modules with low Pmax temperature coefficients (≤ -0.28%/°C)
- Choose advanced N-type architectures (especially ABC) over traditional PERC-based modules
- Incorporate accurate thermal modeling in system design and simulation (e.g., using real ambient and module temperatures)
- Select vendors with proven performance under desert climate testing conditions
In conclusion, thermal coefficient should not be treated as a footnote in technical datasheets—it is a central performance metric, particularly in regions like the Middle East where thermal loads are extreme and persistent. Choosing thermally optimized modules like those offered by Aiko Solar is a strategic decision that aligns technical performance with long-term financial sustainability.
Thermal Coefficient Comparison Table
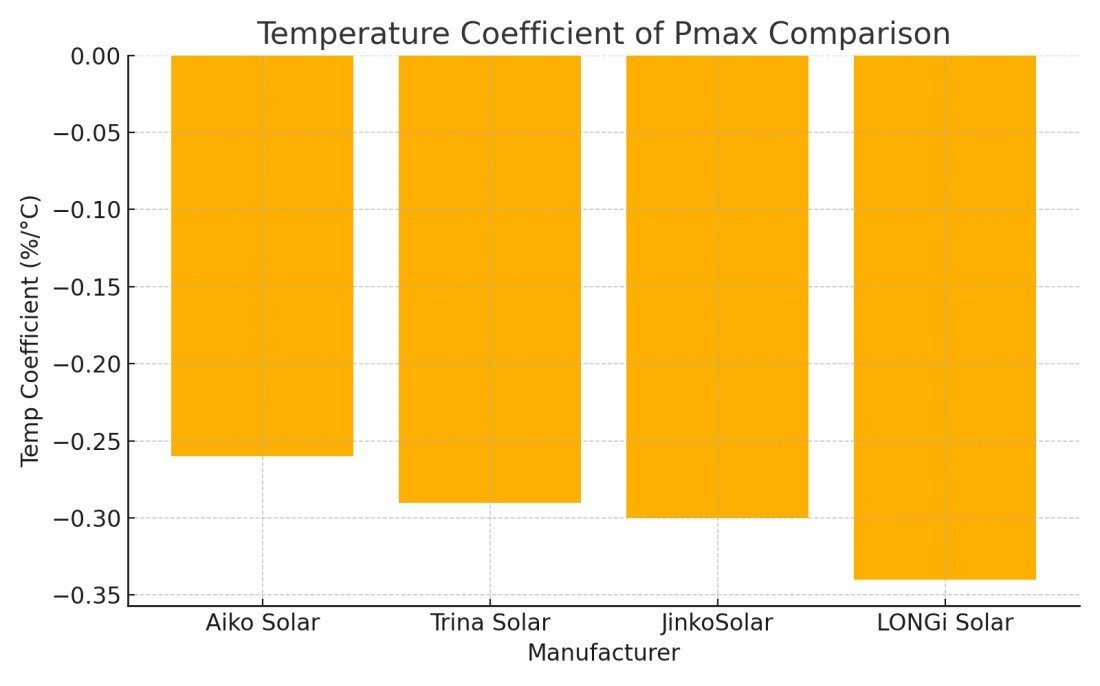
Visual Comparison of Temperature Coefficient
Writors
Amin Esmaeili – CEO & Founder
Dr. Roghaye Motalebzadeh – Steelbridge Ambassador
References
- International Electrotechnical Commission (IEC).
IEC 61215: Terrestrial Photovoltaic (PV) Modules – Design Qualification and Type Approval, Edition 2. Geneva, Switzerland: IEC, 2021.
- International Electrotechnical Commission (IEC).
IEC 61724: Photovoltaic System Performance Monitoring – Guidelines for Measurement, Data Exchange and Analysis, Edition 2. Geneva, Switzerland: IEC, 2017.
- Aiko Solar.
ABC N-type Module Series Technical Datasheet, Aiko Solar Global, 2024.
www.aikosolar.com
- Trina Solar.
Vertex N TOPCon Series Datasheet, Trina Solar Ltd., 2024.
www.trinasolar.com
Tiger Neo N-type Datasheet, JinkoSolar Holding Co., Ltd., 2024.
www.jinkosolar.com
- LONGi Solar.
Hi-MO 6 PERC Series Datasheet, LONGi Green Energy Technology Co., Ltd., 2024.
www.longi.com
- Jordan, D. C., & Kurtz, S. R.
Photovoltaic Degradation Rates – An Analytical Review, Progress in Photovoltaics: Research and Applications, 21(1), 2013, pp. 12–29.
https://doi.org/10.1002/pip.1182
- NREL (National Renewable Energy Laboratory).
Best Practices for PV System Design Under Hot Climate Conditions, NREL Technical Report, 2020.
www.nrel.gov
- IEA PVPS Task 13.
PV Performance and Reliability in Desert Climates, International Energy Agency, Photovoltaic Power Systems Programme, 2021. www.iea-pvps.org
- Fraunhofer ISE.
Photovoltaics Report, 2024 Edition.
https://www.ise.fraunhofer.de
related: Optimizing Solar Panel Performance: Dust Control and Thermal Loss Prevention
FAQ
- What is the temperature coefficient of power (Pmax) in solar panels?
The temperature coefficient of power (Pmax) is a percentage that indicates how much a solar panel’s output decreases for each degree Celsius above 25°C. A typical value is between -0.26%/°C to -0.40%/°C. Lower (less negative) values indicate better thermal performance, which is crucial in hot climates. - Why is thermal derating critical for solar panel performance in the Middle East?
In regions like the Middle East, ambient temperatures often exceed 40°C and module surface temperatures can surpass 70°C. Thermal derating significantly reduces power output under these conditions, affecting yield, return on investment (ROI), and overall system stability over 25+ years. - How do different PV technologies compare in terms of temperature coefficient?
P-type PERC: ~ -0.34%/°C
N-type TOPCon: ~ -0.30%/°C
N-type ABC (Aiko Solar): ~ -0.26%/°C
Advanced N-type ABC modules show superior thermal resilience, retaining more energy output under extreme heat and offering long-term financial benefits. - What is a thermal derating curve and why is it important?
A thermal derating curve graphically represents how solar panel output declines with rising temperature. It visualizes operational losses between 25°C to 80°C and helps system designers compare module performance under real-world heat conditions—critical for bankability and plant optimization. - Which standards govern thermal performance of PV modules?
Key international standards include:
IEC 61215: Validates PV module thermal durability and performance through rigorous testing.
IEC 61724: Outlines field monitoring methods, including temperature tracking and energy yield correction.
Compliance with these standards ensures thermal performance is both certified and continuously monitored. - How does thermal performance affect Levelized Cost of Energy (LCOE)?
Better thermal coefficients reduce energy loss, resulting in higher annual energy production. Over a 25-year project life, this can lead to reduced LCOE, faster payback periods, and higher internal rate of return (IRR), making such modules more attractive to financiers and EPCs.